Microorganism Control in HVAC System Using UV Light Under Tw
| 论文类型 | 基础研究 | 发表日期 | 2005-10-01 |
| 来源 | Macau Environment and City Development 2002 | ||
| 作者 | L.M.Tam,P.K.Wong,S.C | ||
| 关键词 | Microorganism HVAC Ultraviolet light Indoor air quality | ||
| 摘要 | Microorganism, such as the common yeast and mold or the dangerous tuberculosis (TB) is in fact a potential health threat to the occupants working in the indoor environment. Nowadays, most of the people work in indoor environment with air conditioning syst | ||
Macau Environment and City Development 2002
Microorganism Control in HVAC System Using UV Light Under Two Different Working Conditions
L. M. Tam*, P. K. Wong*, S. C. Tam*
*Faculty of Science and Technology, University of Macau
K. T. Sou+,
+ Instituto Para os Assuntos Civicos e Municipals
Abstract: Microorganism, such as the common yeast and mold or the dangerous tuberculosis (TB) is in fact a potential health threat to the occupants working in the indoor environment. Nowadays, most of the people work in indoor environment with air conditioning system. If the air-handling unit (AHU) of the central air conditioning system is lacked of proper maintenance, due to the dark-moist condition inside and the dust-microorganism collected in the filter within the unit, microorganism will have a perfect condition to generate and duplicate in large amount. The microorganism will be transferred from AHU to the occupying zone through the air duct. Currently, the common methods used in microorganism control are (1) ventilation method and (2) filtration method. Both methods are high in cost. The use of ultra-violet light for microorganism control may be the most cost-effective way. This study experimentally investigates the usage of ultra violet light in microorganism control using an environmental chamber with a scale down AHU under no-fresh air and full-fresh air experimental conditions. Favorable conditions for the growth of microorganism are generated within the AHU and the chamber before the activation of the UV light. Air samples are collected under different experimental conditions in sampling agar dishes using an impact air sampler for each air change after the activation of the UV light. Total bacteria count (PCA) and yeast and mold count (PDA) are measured in terms of colony forming unit (CFU). The experimental results show that the microorganism reduction rate is a function of the intensity of the ultra violet light, the air velocity, and the temperature of the air. When the experimental condition is set as no-fresh air, the microorganism can be reduced to a very low and safe level after 4 to 5 recirculated air changes. When the experiments are conducted under full-fresh air conditions, the microorganism reduction rate can be as high as 70 (PDA) to 95% (PCA) for low air velocity. In general, as indicated by the experimental data, the utilization of UV light for microorganism control is effective.
Keywords: Microorganism; HVAC; Ultraviolet light; Indoor air quality
1. introduction
In Macau, high-rise buildings have developed rapidly in recent years and central air conditioning systems are widely used in such buildings. However, heating, ventilation, and air conditioning (HVAC) systems have been shown to act as a collection source for a variety of contaminants which may potentially affect health. Examples of such contaminants include mold, fungi, bacteria, and very small particles of dust and debris. For energy saving purposes, the HVAC designers prefer to use small amount of ventilation air and most of the supply air to the occupying zone are recirculated. As a result, concentration of the contamination will be increased gradually since fresh air is not enough to dilute the concentration of contamination inside the air conditioning area.
Buildings with an unusual numbers of occupants having physical problems have come to be described as having "Sick Building Symptoms". "Sick Building Syndrome" is the name commonly used to describe such energy efficient buildings that are not equipped with proper air quality control systems to remove indoor air contamination. The presence of microorganisms in indoor environments may cause allergic building-related illnesses. According to ASHRAE Handbook Fundamental (1990), some microorganisms such as bacteria, virus, mold under certain conditions may produce volatile chemicals that are malodorous or irritating, thus contributing to the development of what is called sick building syndrome. So such sick building syndrome (SBS) is an ailment of the 1990‘s in such tight design modern buildings. Harmful contamination in the air inside the buildings always lead to an increased number of complaints of headaches, eye and throat irritation, breathing difficulties, stuffy noses, bacterial infection, and even the spreading of diseases within hospitals, causing harm to the patients and occupants. Table I shows the common building-related diseases.
The environment inside the modern air ducting systems or air handling units provides sites for microorganisms to colonize and breed. The HVAC systems have been shown to act as a collection source for a variety of contaminates such as mold, fungi, bacteria, and very small particles of dust and debris that have the potential to affect health. The moist components of the central air conditioning system, such as filters, cooling coil, drain pan and drainage piping are ideal growing sites for bacteria development. The bacteria developed at these ideals growing sites will be distributed to the occupants and recirculated again inside the closed air conditioning area. Without an effective air quality control method, the density of the bacteria may increase day by day.
According to, Jagjit Singh (1996), Karin (1997), Morey and Elliot (1998), Rask et. al. (1998), and Jones (1999), their works indicate that the control of microorganism plays an important role in having good indoor air quality. Upper-room UV is an effective way in controlling microorganism as indicated by Riley et. al. (1976). However, according to Nardell (1997), research on upper-room UV to control microorganism is relatively inactive in decades. Firmly established application guidelines are not yet available and this method can only eliminate the microorganism in the room without cleaning the "source", i.e., the central air conditioning system. Since there is no systematic research on the application of ultra violet germicidal irradiation (UVGI) on central air conditioning system, this research hopefully can shed some light in this area.
The objectives of this study are to conduct a series of control experiments to investigate: (a) the influence of UVGI light intensity on microorganism control, (b) the influence of air velocity inside the air handling unit on microorganism control, (c) the influence of the UVGI lamp installation location on microorganism control. The total bacteria count (PCA) and yeast and mold count (PDA) obtained from air samples are used for analysis.
2. experimental setup
The experiments were conducted in a dynamic environmental chamber which is 3.1m width, 2m depth and 1.9m height (see figure 1). The chamber is connected to a computer linked air conditioning system with supply air volume control, temperature control, humidifying and de-humidifying functions, to generate various experimental conditions. Properties such as the dry bulb and wet bulb temperatures are monitored in different locations within the air conditioning unit. In order to simulate the central air handling system, supply and return air plenums with UVGI lamps inside are installed inside the chamber and are connected to the air conditioner with 250 mm diameter aluminum flexible duct to form a closed air-recirculation system. Two sets of additional fan inside the supply air plenum are used to generate different air velocity. The air velocity passing through the UVGI lamps is set to 2m/s or 4m/s for all the experimental runs. As seen in figure 2, an extra data logger is installed to monitor the dry and wet bulb temperatures across the UVGI lamp. The conditions of the test chamber are also monitor by the extra data logger.
table 1 Building-Related Diseases
History and Physical Examination Laboratory Testing
Linkage
Causes
RhinitisSinusitis
Stuffy/runny nose, post-nasal drip, pale or erythematous mucos Anterior and posterior rhinomanometry, acoustic rhinomerty, nasal lavage, biopsy, rhinos copy, RAST or skin prick testing Immunology skin prick or RAST testing, bradketted physiology Direct occupational exposures; molds in the workplace; specific occupational factors (laser toners, carbonless copy paper, cleaning agents), secondary occupational exposures; pet(e.g. cat) danders brought from home. Asthma
Coughing, wheezing, episodic dyspnea, wheezing on examination, chest tightness, temporal pattern at work Spirometry before and after work on Monday, peak expiratory flow diary, methacholine challenge Immunologic: skin prick or RAST testing.
Physiologic: related to work* See rhinitis/sinusitis Hypersensitivity pneumonitis
Cough, dyspnea, myalgia, weakness, rales, clubbing, feverishness
DLCO, FVC, TLC, CKR, lung biopsy
Immunologic: IgG ab to agents present, challenge testing
Physiologic (in acute forms): spirometry, DLCO
Molds, moisture Organic dust toxic syndrome Cough, dyspnea, chest tightness, feverishness DLCO, TLC, WBC Temporal pattern related to work Gram negative bacteria Contact dermatitis(allergic) Dry skin, itching, scaling skin Scaling rash, eczema biopsy Patch testing Molds, carbonless copy paper, laser toners Contact urticaria Hives Inspection biopsy Provocative testing Office products(carbonless copy paper)
Eye irritation Eye itching, irritation, dryness Tear-film break-up time, conjunctival staining(fluorescein) Temporal pattern Low relative humidity, volatile organic compounds (allergic conjunctivitis), particulates Nasal irritation Stuffy, congested nose, rhinitis Acoustic rhinometry, posterior and anterior rhinomanometry, nasal lavage, nasal biopsy Temporal pattern Low relative humidity, volatile organic compounds (allergic conjunctivitis), particulates Central nervous system symptoms Headache, fatigue, irritability, difficulty concentration Neuropsychological testing Temporal pattern(epidemiology) Volatile organic compounds, noise, lighting, work stress, carbon monoxide, cytokines from bioaerosol exposure Legionnaire‘s Disease
Pneumonic illness History, Legionella culture from biopsy fluids 1)Organism isolated from patient and source.
2)immunologic watch Aerosols from contaminated water sources, shower heads, water faucet aerators, humidifiers at home and at work, potable water sources (hot water heaters, etc.) *(1) 10% decrement in FEV1 across workday,
(2) Peak flow changes suggestive of work relatedness, and
(3) Methacholine reactivity resolving after six weeks away from exposure
RAST = radio allergen sorbent test
DLCO = single breath carbon monoxide diffusing capacity FVC = forced vital capacity
TLC = total lung capacity
CXR = chest x-ray
lgG = class Gimmune globulins
FEV1 = forced expiratory volume in the first second
Dirty filters were used to generate microorganism inside the chamber. Since filter is acted as a collector of dust and microorganism, with suitable conditions, it may be treated as the source and it may reflect the actual working condition of an air handling unit. To generate the microorganism inside the test chamber, two dirty air filters (size: 1115 mmx655mmx19mm) from an air handling unit of a specific building were taken out and were placed inside the chamber for 48 hours. According to ASHRAE Standard 62a-89 (1990), the relative humidity in the test chamber is always set higher than 70% such that microorganism contamination can duplicate easily. Usually, microorganisms will grow up to around 10000 to 30000 CFU/m3 before the activation of the UVGI lamps.
The UVGI lamps used in this study is "SE161V0-16" by "STERIL-AIRE". The power rating for each lamp is 60W. Two sets of UVGI lamps are installed in the supply and return air plenum respectively with a combine power rating of 240W.
In order to standardize the experimental conditions within the chamber, the temperature is set to 21oC and the humidity is set to 50% RH for each experimental run. The air velocity passing the UVGI lamp is fixed to 2m/s or 4m/s. The UVGI lamps are turned on at the supply or (and) return air plenum with different power rating for different experimental runs.
3. results and discussions
Control experiments are conducted to show the relation of the bacteria reduction rate with the air velocity, the air volume passing through the UVGI lamp, the intensity (i.e. the power rating) of the UVGI lamp(s), and the initial condition of the microorganism under full fresh air and full recirculated air experimental conditions.
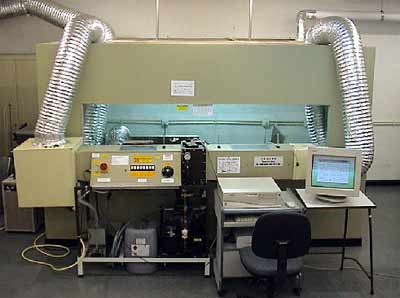
figure 1. dynamic environmental chamber
figure 2. schematic diagram for the dynamic environmental chamber
3.1. relation between microorganism reduction rate and different UVGI intensities under no fresh air condition
The installation of UVGI lamps will add extra cooling load on the air handling unit hence wasted energy. In order to control microorganism and save energy, it is necessary to inve stigate the relation between UVGI intensity in terms of the lamp‘s power rating and the reduction rate of microorganism. The ratio between the initial CFU values (before the activation of the UVGI lamp) and the CFU values after the activation of the UVGI lamp is used to show the reduction rate of microorganism as a function of different UVGI intensity (60w and 120w) for two sets of PCA data under 2m/s air velocity. As seen in figure 3, the reduction rate of microorganism is more effective for the 120w setting in the first few recirculated air changes. After that, the effect of higher intensity is not as significant. It can be concluded that high UVGI intensity can be set inside the air handling unit for the first few air changes. When the number of air change increases, it is recommended to switch to lower UVGI intensity for energy saving purposes.
figure 3. effect of UVGI intensity on the reduction rate of microorganism.
3.2. relation between microorganism reduction rate and different UVGI installation locations under no fresh air condition
In order to evaluate the proper location for the installation of the UVGI lamp, experiments are conducted with the UVGI lamp installed in either the supply or the return air plenum. The CFU per 100 liters of air for both PCA and PDA counts were checked. As indicted by figure 4, it can be seen that the reduction rate of microorganism is higher when the UVGI lamp is installed in the return air plenum. The efficiency of the reduction rate of microorganism increases as air temperature increases since the temperature of the return air plenum is several degrees higher than the supply air plenum.
figure 4. effect of different UVGI installation locations on the CFU count per 100 liters of air
3.3. relation between microorganism reduction rate and different velocity and initial contamination conditions under no fresh air conditions
Two velocity settings (2m/s and 4m/s) inside the plenum were used to investigate the reduction rate of microorganism. These two velocities are commonly used in normal scale air handling unit. The results for PCA and PDA counts under different velocity were examined separately. The initial contamination condition for each experimental run was different. As mentioned in the previous section, it is very difficult to establish the same initial conditions for each experimental run and hence difficult to make comparisons. Therefore, the ratio between the initial CFU values (before the activation of the UVGI lamp) and the CFU values after the activation of the UVGI lamp is used to examine the data.
Figures 5 and 6 show the reduction rate of microorganism for PDA and PCA counts in terms of CFU ratio under different velocity and initial contamination conditions. For PDA, 13 experimental runs with 65 data points were used for the 2m/s setting and 11 experimental runs with 82 data points were used for the 4m/s setting. For PCA, 13 experimental runs with 67 data points were used for 2m/s setting and 7 experimental runs with 50 data points were used for 4m/s setting.
figure 5. PDA reduction rate under different velocities and initial contamination conditions
For the case of PDA, it can be seen that for the 2m/s air velocity setting, the CFU values drop to about 40 to 60% of the initial value (i.e. CFU/CFUinitial = 0.4 to 0.6) after the first recirculated air change. The sharp decreasing rate continues until the number of recirculated air change approximately equals to 4 to 6. It can be observed that the CFU ratio for different experimental runs approached a specific asymptote ranged from around 0.03 to 0.13. When the velocity is set to be 4m/s, it can be observed that the CFU values drop to about 20 to 60% of the initial values after the recirculated air change is equal to 2. It means that for the 4m/s velocity setting, it takes twice the time to achieve the killing rate of microorganism similar to the 2m/s setting. The CFU ratio decreases as the number of recirculated air change increases. When the number of recirculated air change approximately equals to 8 to 12, the CFU ratio value will reach asymptotic values ranged from 0.04 to 0.14 depends on different initial conditions.
figure 6. PCA reduction rate under different velocities and initial contamination conditions
For the case of PCA, the trends are very similar. As seen in figure 6, the CFU values for the 2m/s setting drop to about 30 to 60% of the initial value after the first recirculated air change. The sharp decreasing rate continues until the number of recirculated air change approximately equals to 4 to 8. The asymptotic behavior is not as obvious as the previous case. When the air velocity is equal to 4m/s, it can be seen that the CFU values drop to about 40 to 90% of the initial values. When the number of recirculated air change increases, the CFU ratio decreases sharply. Similar to the case of PDA, it takes twice the time to achieve the comparable reduction rate when the velocity setting is equal to 4m/s.
3.4. the reduction of microorganism with long term UV light exposure with full recirculated air
It would be interested to see how the microorganism‘s reduction rate changes with time with the UV light keeps turning on for a relatively long period of time. The on time of the UV light ranges from 16 to 148 hours. Figure 7 showed the results. The reduction rate for PCA and PDA ranges from 64 to 100%. Therefore, turning on the UV light within the central air conditioning system continuously could keep the microorganism in a relatively low level.
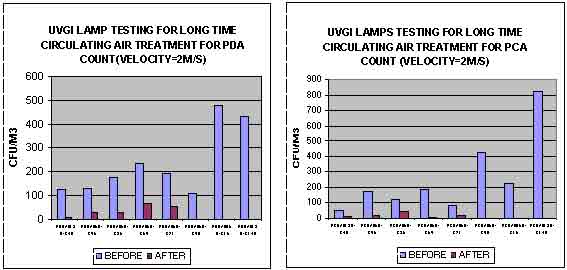
figure 7 the reduction of microorganism recirculated air under long term UV exposure
3.5. microorganism reduction rate under full fresh air condition
The microorganism reduction rate under full fresh air condition is investigated. Unlike the no fresh air condition, the air will only be treated by UV light once. The air velocities are set to be 2m/s and 4 m/s respectively. Figure 8, and 9 showed the results.
As seen in these figures, the microorganism reduction rate ranges from 50 to 95% for PCA and 32 to 70% for PDA when the air velocity is set to be 2m/s. When the air velocity is set to be 4m/s, the reduction rate ranges from 22 to 74% PCA and 10 to 64% for PDA. Since the time for the microorganism exposed to UV light is shorter for 4m/s, the reduction rate for 2m/s is higher than that for 4m/s in general.
4. conclusion and recommendation
Experiments are conducted to investigate the use of ultraviolet light to control the microorganism generated within the air handling unit. The results indicate that high UVGI intensity is very effective in reducing the microorganism for the first few air changes. When the number of recirculated air change increases, the effect is not that significant in comparison to low UVGI intensity. The results also indicate that it is better to install the UVGI lamp in the return air plenum since the killing rate of microorganism increases as temperature increases. The effects of velocity and initial CFU conditions on the killing rate of microorganism are also investigated. According to the experimental data, it takes twice the time for the high velocity (4m/s) setting to have approximately the same killing rate of microorganism as the low velocity setting (2m/s).
The microorganism reduction rate under 100% recirculated air with long term UV exposure and full fresh air working condition with the UV light installed in the plenum are also investigated. For long term exposure, the microorganism reduction rate with the UV light turned on for 16 to 148 hours, the microorganism can be kept in a relatively low level as indicated by the reduction rate. For one time UV light treatment, it can be seen the microorganism reduction rate is higher for 2m/s in comparison to 4m/s. This is directly due to the UV exposure time. One time treatment is therefore still effective for low air velocity. When the air velocity increases, the microorganism reduction rate decreases.
Since this experiments conducted in this study are based on the worse operating condition (100% recirculated air) and the best operating condition (100% fresh air) of the air handling unit, to make this study more comprehensives, similar experiments should be conducted with fresh air added into the recirculated air stream.
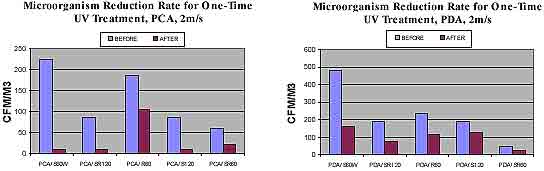
figure 8 one-time UV treatment for PCA and PDA for 2m/s air velocity
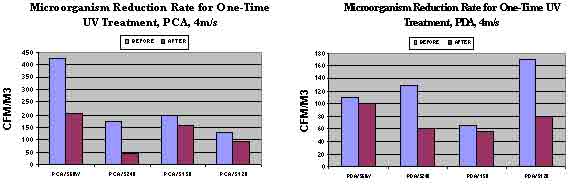
figure 9 one-time UV treatment for PCA and PDA for 4m/s air velocity
Reference
ASHRAE Handbook Fundamentals, 1990
Jagjit Singh, Impact of Indoor Air Pollution on Health, Comfort and Productivity of the Occupants, Aerobiologia, vol. 12, 121-127, 1996
Jones, A. P., Indoor Air Quality and Health, Atmospheric Environment, vol. 33, 4535-4564, 1999
Karin, F. Douglas V.O., and Meyers, E., Investigation of Contact Vacuuming for Remediation of Fungal Contaminated Duct Materials, Environmental International, 23, No.6, pp751-762, 1997
Morey P.H., and Elliott W., Fungi and Microbial VOCs in Indoor Air -What do the data mean? How much fungal growth is too much?, Design, Construction and Operation of Health Buildings, pp123-129, 1998
Nardell, E.A., Global Health Care Facility Issue- A Medical Perspective: Environmental Control of Tuberculosis in Industrial and Developing Countries. Proceeding of Health Building/IAQ 97, pp23-31, 1997
Rask D.R., Dziekan B., Swincicki W.C., Patricia A. H. and Walmsley D.J., Air Quality Control During Renovation in Health Care Facilities, Design, Construction and Operation of Health Buildings, pp291-297, 1998
Riley, R. L, Knight, M., and Middlebrook, G., Ultraviolet Susceptibility of BCG and Virulent Vubercle Bacilli. Am. Rev. Resp.1 Dis., Vol. 113:413-418, 1976
close
www.h2o-china.com相关推荐
- Artificial neural network modeling of water quality of the Yangtze River system: a case study in reaches crossing the city of Chongqing
- An internal airlift loop bioreactor with Burkholderia pickttii immobilized onto ceramic honeycomb support for degradation of quinoline
- Performance of simultaneous nitrification and denitrification in lateral flow biological aerated filter
- Water quality changing trends of the Mi yun Reservoir
- Water quality changing trends of the Miyun Reservoir
- System Design Approach Using Ultraviolet and Ozone for Waste
论文搜索
月热点论文
论文投稿
很多时候您的文章总是无缘变成铅字。研究做到关键时,试验有了起色时,是不是想和同行探讨一下,工作中有了心得,您是不是很想与人分享,那么不要只是默默工作了,写下来吧!投稿时,请以附件形式发至 paper@h2o-china.com ,请注明论文投稿。一旦采用,我们会为您增加100枚金币。